Floorplans
SAP Fiori floorplans are UI blueprints or templates created by SAP that define how an application’s screens will look and how users can interact with them. They are essentially pre-built UI templates that handle the heavy lifting of user interface (UI) development, which previously involved extensive UI coding using XML views.
Key advantages about floorplans
Fiori floorplans offer several significant benefits for app development:
- They enable low-code development by significantly reducing the amount of UI code developers need to write and maintain. This allows developers to focus primarily on business logic and back-end services.
- Floorplans provide a consistent user experience by adhering to SAP Fiori design guidelines automatically. This consistency covers look and feel (colors, fonts), layout of information, and interaction patterns.
- SAP Fiori elements uses SAPUI5 technology as its foundation, which supports cross-platform SAP Fiori apps with a single code line and includes built-in support for enterprise-grade standards like security and integration.
- Floorplans make it easy to scale app development to create hundreds or even thousands of SAP Fiori apps. This is crucial for organizations needing to build apps quickly and cost-effectively to respond to market changes.
Description of Each Fiori Floorplan
- List Report: Used to display and manage large amounts of data in list or table form. It allows users to filter, sort, and group items.
- Object Page: Provides a detailed view of a single business object. It supports displaying details (text, charts, images) and performing CRUD (Create, Read, Update, Delete) operations on that object.
- Worklist Page: A simplified version of the list report, optimized for processing a list of tasks or work items. It focuses on actions rather than browsing data.
- Analytical List Page (ALP): A specialized form of list report with additional analytics capabilities to visualize and analyze data. It’s designed for users working with large datasets, KPIs, and visual trends, allowing them to drill down and take action within a single screen.
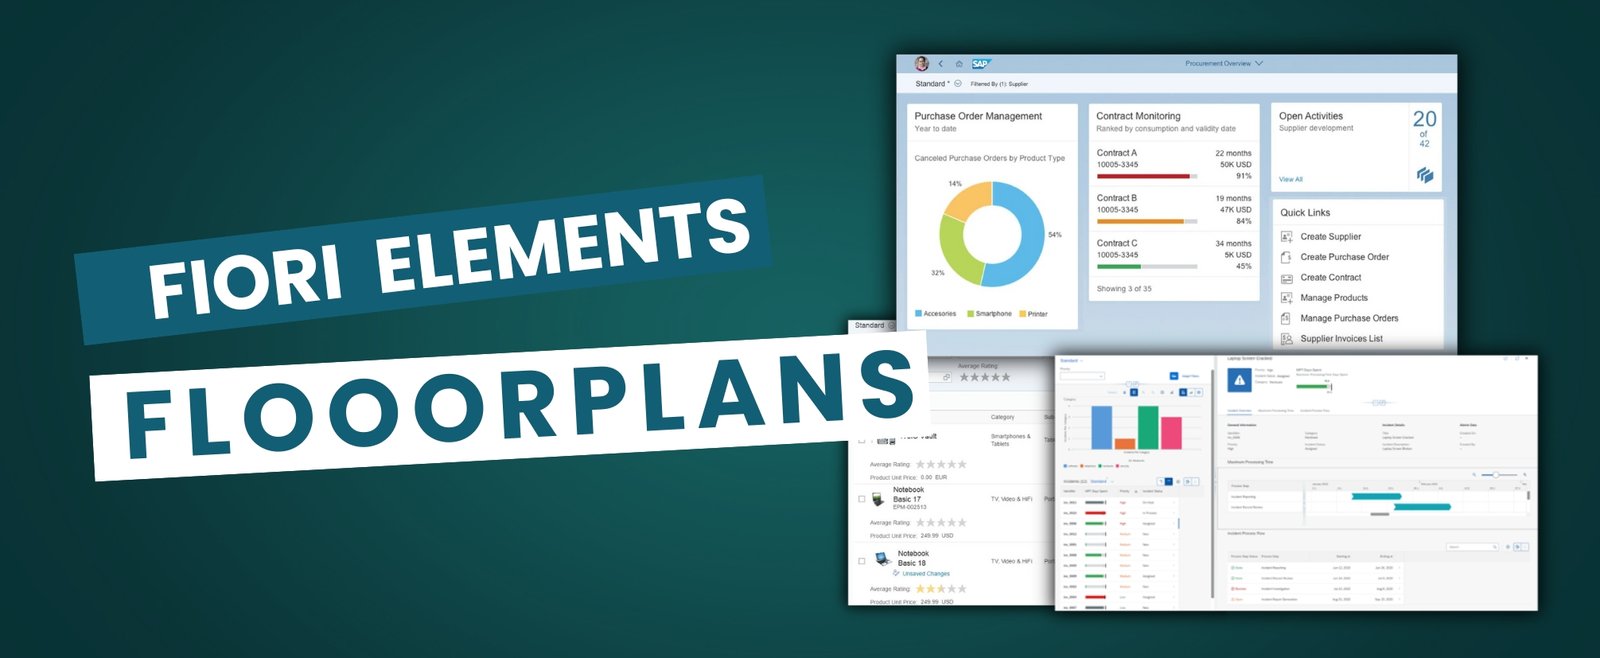
- Overview Page: Provides a dashboard-like overview of a specific business area or role, acting as a starting point for business processes. It displays key performance indicators (KPIs), notes, diagrams, and graphics.